
Temporal Tracing With Datadog: A Go Example

This post shows how to add Temporal tracing to a Go workflow, with Datadog as the tracing service. If you are new to Temporal, start with our posts on Temporal workflows and microservices, Temporal context propagation and Temporal universal starters.

In short, Temporal tracing records each step of a workflow run as a span and joins those spans into one trace. So you can see which service did what, in what order and for how long. In Go, the quickest route today is the Temporal SDK’s Datadog tracing interceptor. This post also walks through the manual route: a custom context propagator for Datadog trace headers.

What Is Distributed Tracing?

Microservice architecture has clear advantages.

It gives you scalability, resilience and performance.

It also makes code easier to maintain, extend and reuse.

However, microservices also bring problems.

System status and monitoring get harder, the infrastructure grows complicated, and deployments need orchestration.

Workflows need orchestration as well, and code reuse across services takes real effort.

Temporal solves workflow orchestration and improves both the infrastructure and system monitoring. That is because Temporal acts as the transport and handles discovery, load balancing, retries and backpressure. Meanwhile, the Temporal UI shows workflow and activity status through the Temporal server API.

Still, tracing makes it much easier to monitor and understand what happens during a workflow run.

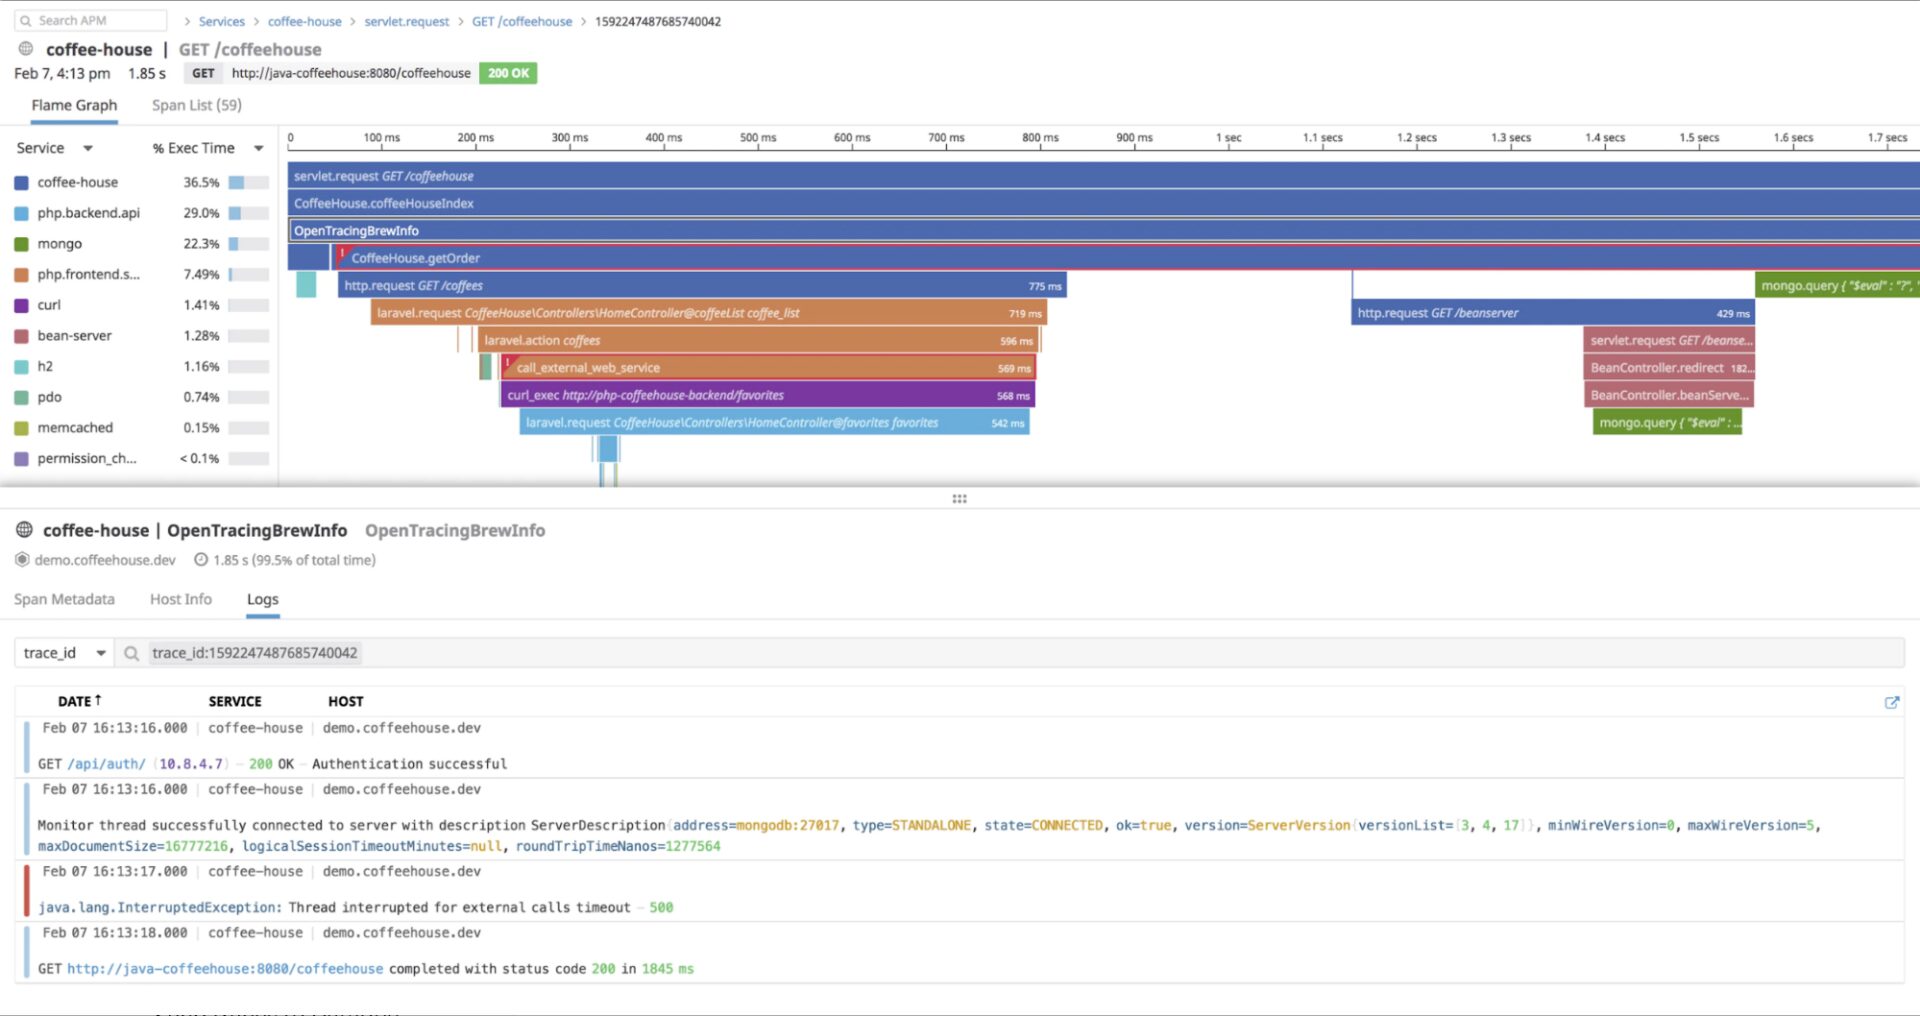
Tracing draws a flame graph of one run across a microservice system, where each row is a span for some service activity. Every span except the root has a parent, and spans can have children. That parent and child structure is the key to reading a trace. All the spans for one process belong to a single trace. That answers a question logs and metrics can’t answer alone: where the time went in one request.

Flame graph of one request, with a colored row for each service span

Each span carries tags, such as the function name, service name and version. It also records the start and end time.

With this kind of tracing, you can explore what happens during a workflow run visually. Each service shows up in its own color, so you can see when it takes part. You can also spot patterns and find the slowest or most frequent steps to optimize.

How a Tracing Service Collects Spans

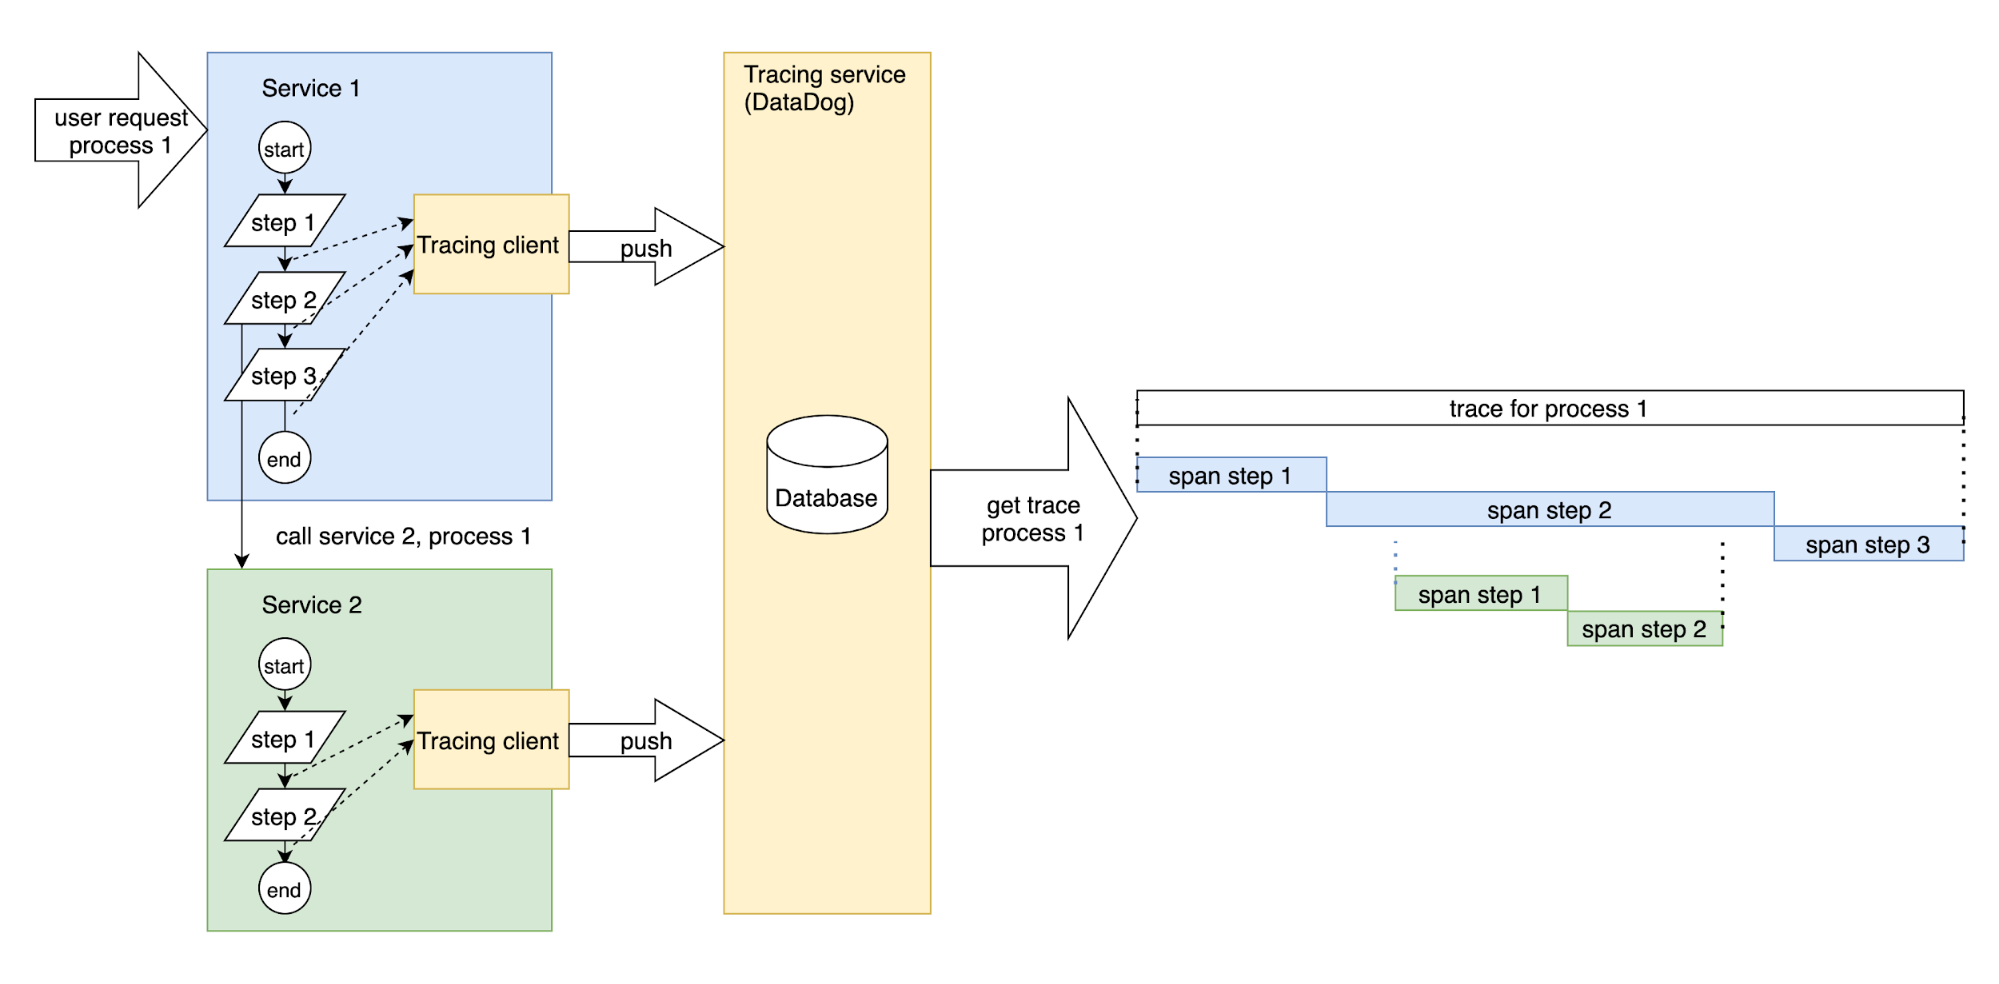
The tracing system itself runs as a separate service. Your services use a tracing client to start and finish spans. When a span finishes, the client pushes it to the tracing service, which stores spans and traces. In the end, you have everything a visual trace needs: the spans and their parent and child links.

How Temporal tracing works: services send spans through a tracing client to a tracing service that assembles the trace

Why Datadog for Temporal Tracing?

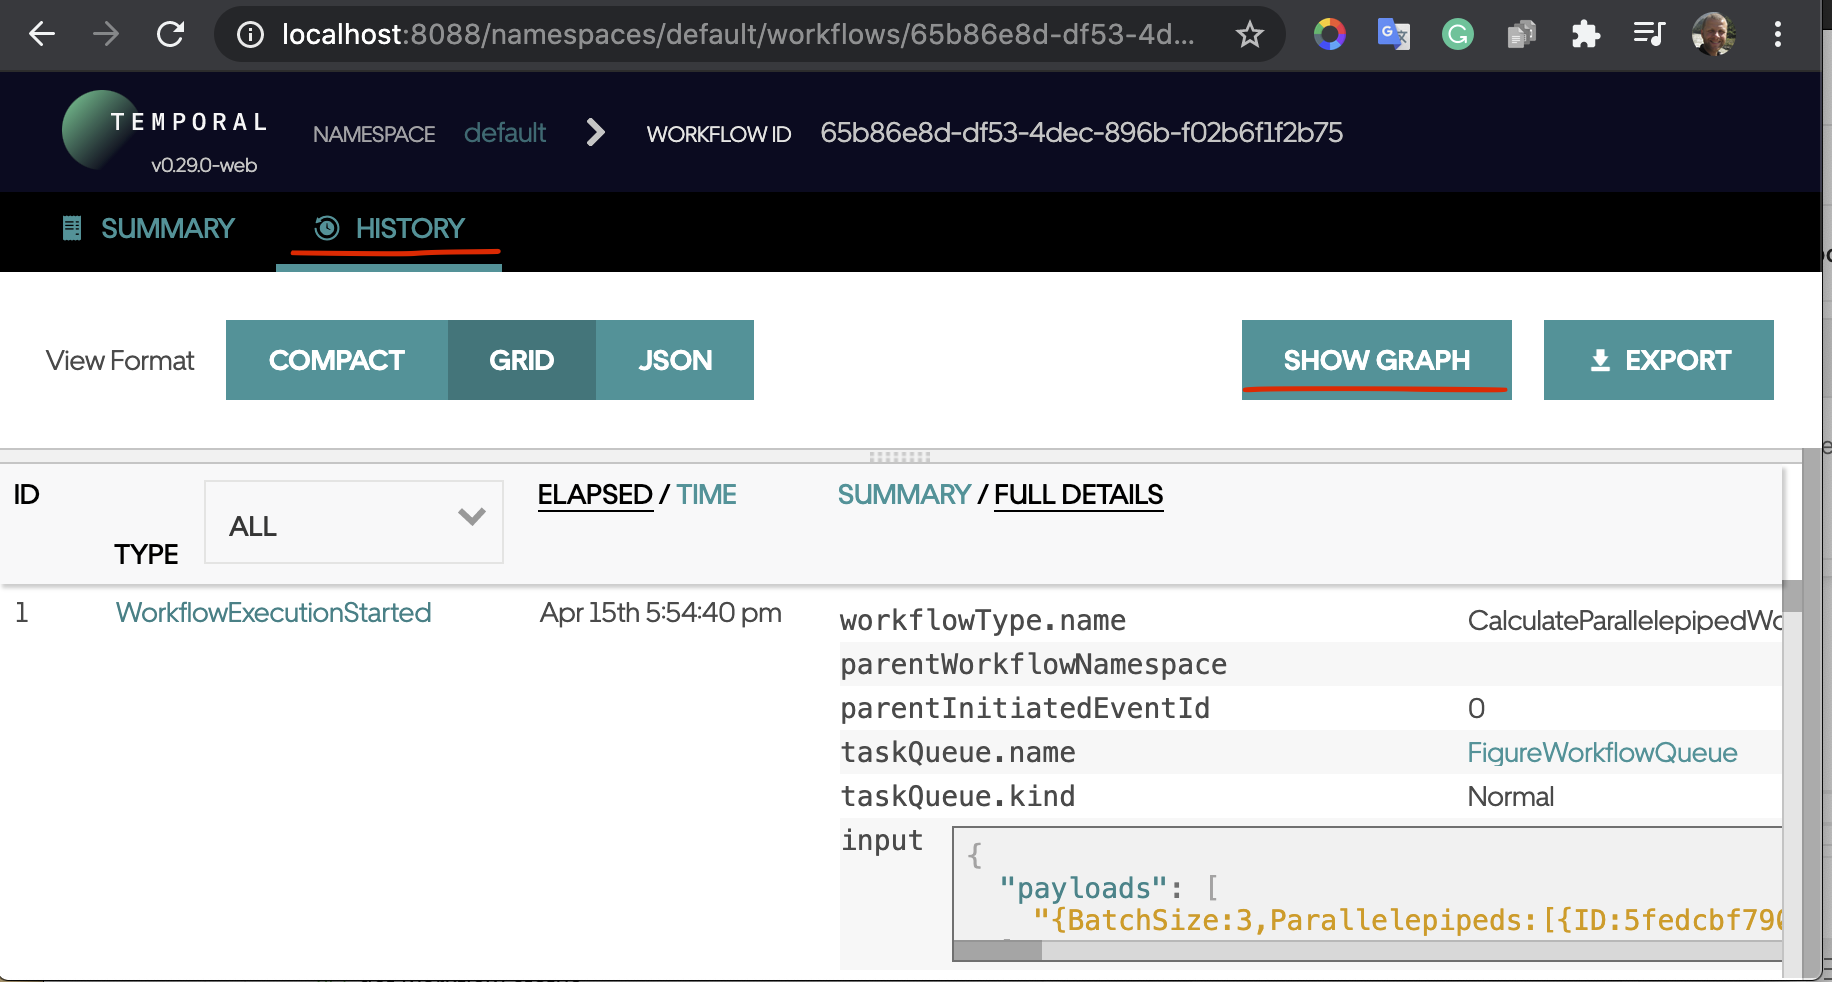
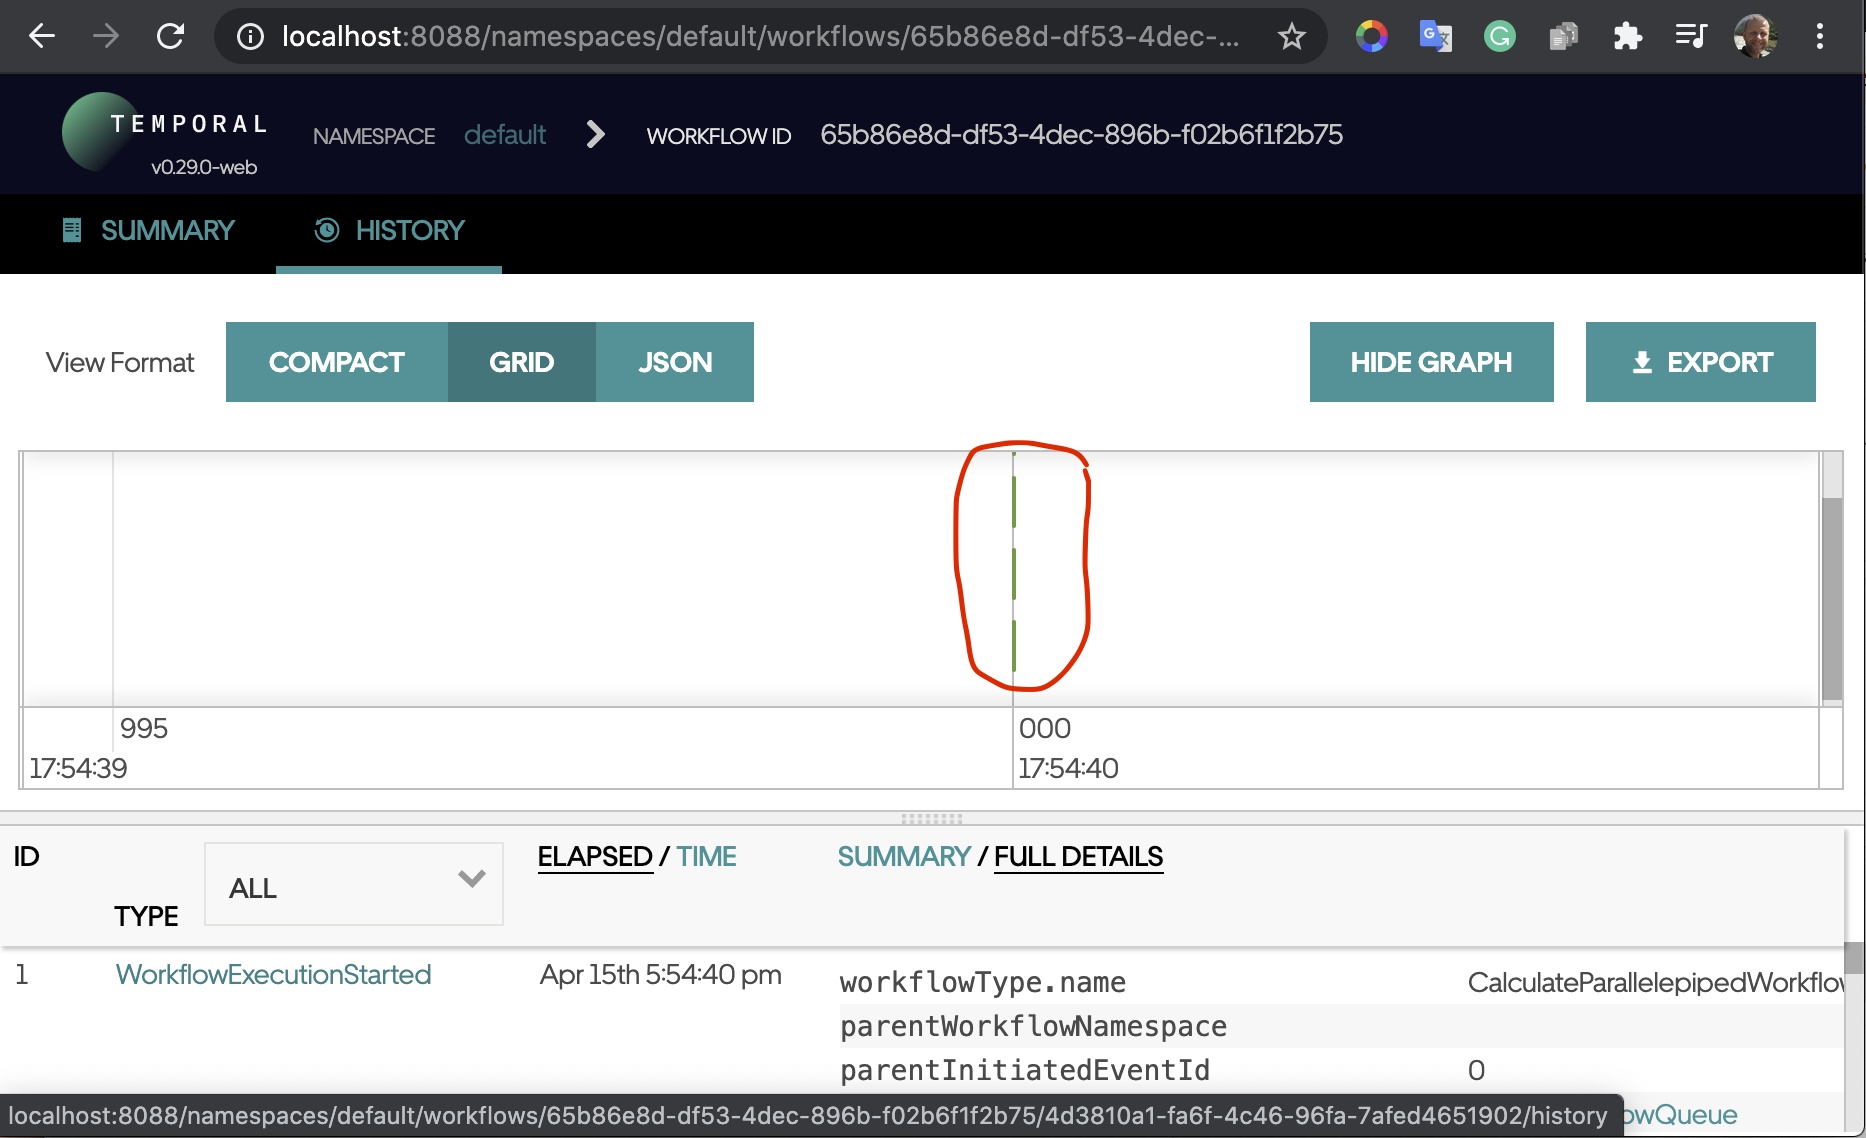
Temporal can build traces on its own, and you can view them in the Temporal UI:

History view of the CalculateParallelepipedWorkflow run in the local web UI
Graph view of the same run, showing activity timing in the local web UI

However, those traces show activity spans only. You can’t add spans for the details inside a service, and the view is plain, with no colors and no detail. That is fine, because the Temporal UI exists to explore workflow runs, not to trace them.

Tracing is a separate concern, so it deserves dedicated tools.

Many commercial tracing platforms and open-source tools are available today. Each has strengths and weaknesses, and comparing them with OpenTelemetry would need a separate post. Our customer chose Datadog as its monitoring system, so this post uses Datadog tracing.

Besides tracing, Datadog covers resource monitoring, log search, alerts, reports and dashboards. It is a commercial product, but it offers a 14-day free trial, so you can test it first. Sign up on the Datadog site, then follow the registration steps to reach your dashboard.

Run the Datadog Agent Locally

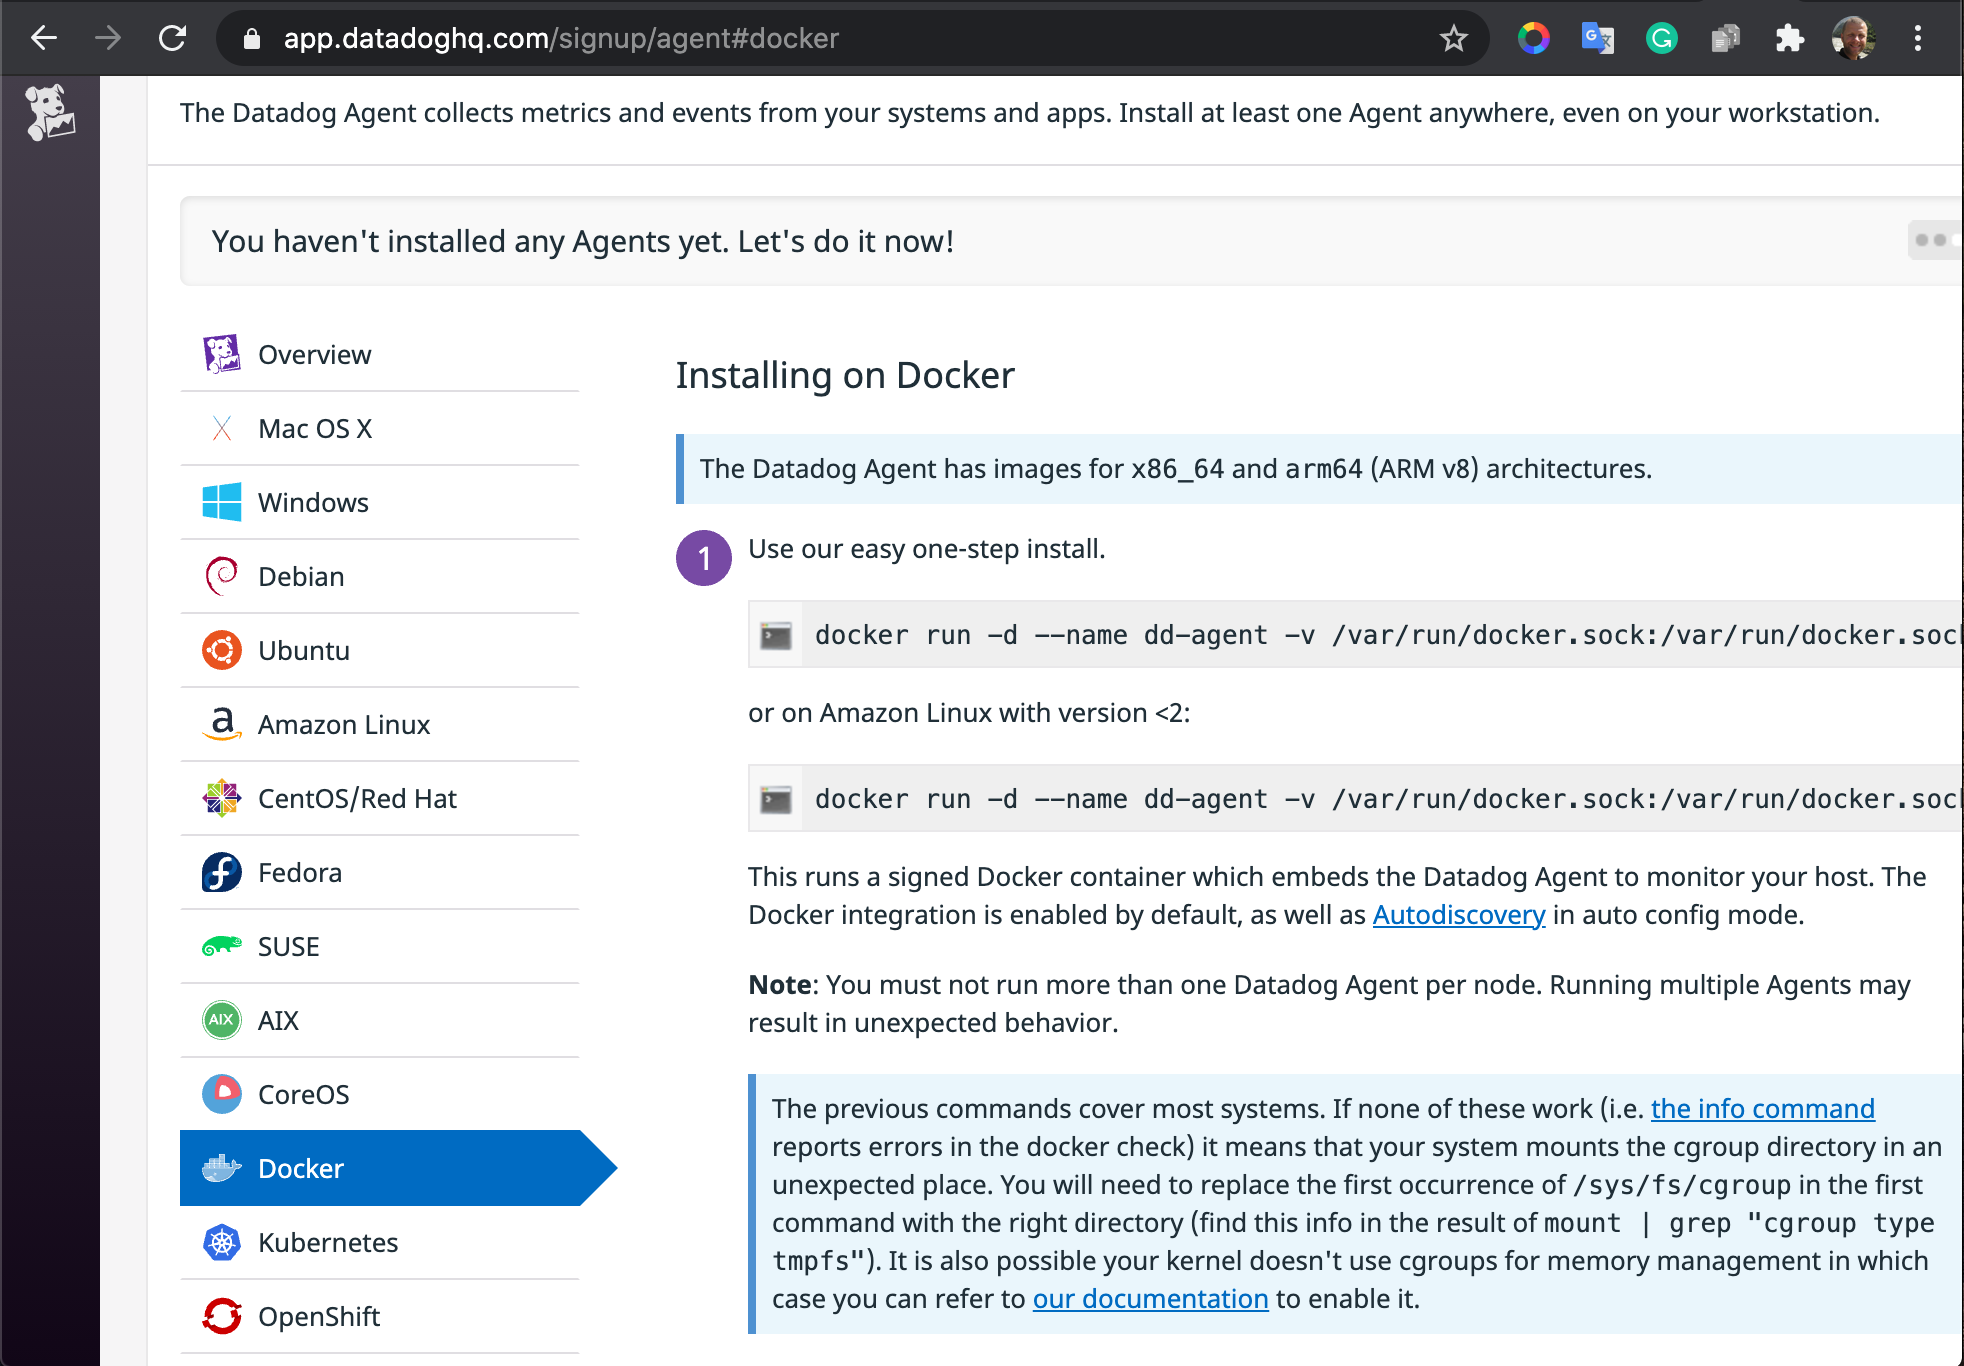
Next, go to Integrations, then Agent, and choose the Docker agent. You need Docker installed on your computer first.

Datadog Agent installation page for Docker, showing the docker run command

Run the Datadog agent as a single Docker container from the command line. Copy the command from the Datadog page, because it contains the API key used for authorization. Then add -p 8126:8126 to the command, so the Datadog client can reach the agent on that port.

Or use the command from the sample repository’s makefile to set up the Datadog agent.

The agent then listens for incoming traces, metrics and logs. By default, the Datadog client finds it at the localhost address.

Why do you need the agent at all? The Datadog tracer inside your application pushes new spans to the local agent. The agent processes them and sends them to the Datadog cloud on a regular schedule.

Getting Traces for a Temporal Workflow

As our Temporal microservices post explains, Temporal works well as a microservices orchestration engine. It lets engineers build complex workflows with retries, backpressure and fault tolerance.

Today, the Temporal Go SDK ships tracing interceptors for OpenTelemetry, OpenTracing and Datadog, as Temporal’s Go observability docs note. When this post was first written, Temporal’s built-in trace propagation targeted formats such as OpenTracing. So Datadog support meant building a custom context propagator by hand, which is the approach below.

The official Datadog interceptor, tracing.NewTracingInterceptor(tracing.TracerOptions{}) from the Temporal SDK’s Datadog contrib package, now handles header propagation for you. For a new project, start there. Build a custom propagator like the one below only if you need behavior the interceptor doesn’t cover, such as non-standard span tags. The custom approach also makes sense if you want to avoid a hard Datadog dependency. The interceptor is Datadog-specific, while the abstraction pattern below keeps you portable.

For the demo, I created a branch of the sample repository for traces. All the samples below come from that repository.

What Should Be Added to Temporal for Tracing?

Context Propagation

Our post on Temporal context propagation explains what context propagation is and why microservices need context.

In short, we need to propagate the context into the Temporal headers, both for the normal context and for the workflow context. The tracing context propagator does this.

The WorkflowHeaderWriteAdapter

				
					https://github.com/guntenbein/temporal_microservices/blob/datadog-tracing/context/propagators/datadog_trace.go#L15-L29


The Datadog Inject function uses this adapter to write trace data from the context into the workflow headers:

				
					https://github.com/guntenbein/temporal_microservices/blob/datadog-tracing/context/propagators/datadog_trace.go#L65


The WorkflowHeaderReadAdapter

				
					https://github.com/guntenbein/temporal_microservices/blob/datadog-tracing/context/propagators/datadog_trace.go#L31-L51


The Extract function uses this adapter to read the context straight into the Datadog trace:

				
					https://github.com/guntenbein/temporal_microservices/blob/datadog-tracing/context/propagators/datadog_trace.go#L90


The code sets no specific tracing fields, so Datadog can use whatever tracing style your account settings call for.

Create a Trace With the Workflow Context

The ordinary Datadog tracer keeps traces in a context.Context structure, but workflows have their own context, workflow.Context. So we need a way to create traces inside the workflow. The StartSpan function in this file does that with the Temporal SDK.

				
					https://github.com/guntenbein/temporal_microservices/blob/datadog-tracing/context/workflow/tracing.go


Tracer Abstractions for Service Tracing

Putting the Datadog tracer straight into the domain services is a bad idea, because replacing Datadog later becomes hard. Instead, I created abstractions for the tracer and the span, Datadog implementations of those abstractions, and no-op implementations that we can use to mock tracing.

Running the Example

To run the project, install Docker and Go.

Then check out the project with this command:

				
					$ git clone https://github.com/guntenbein/temporal_microservices.git


Check out the branch with the trace code:

				
					$ git checkout datadog-tracing


Start the Datadog agent as described in Run the Datadog Agent Locally above.

Then start the Temporal services with this command from the project root:

				
					$ docker-compose up -d


When the Temporal service is up, run the microservices one by one:

				
					$ go run cmd/microservice_square/main.go


					$ go run cmd/microservice_volume/main.go


					$ go run cmd/microservice_workflow/main.go


Then run the workflow with this command:

				
					curl --location --request POST 'localhost:8080' \
--header 'process-id: process-number-42' \
--header 'Authorization: *****' \
--header 'Content-Type: application/json' \
--data-raw '{
 "BatchSize": 3,
 "Parallelepipeds": [
   {
     "ID": "5fedcbf7901feb7213e84153",
     "Length": 7584.6668,
     "Width": 8551.7289,
     "Height": 7911.1765
   },
   {
     "ID": "5fedcbf755d18a8e807432d2",
     "Length": 9854.9176,
     "Width": 2333.052,
     "Height": 9977.8465
   },
   {
     "ID": "5fedcbf776f93aa072884a6e",
     "Length": 6186.1635,
     "Width": 7257.3111,
     "Height": 744.9772
   }
 ]
}'


The workflow runs and returns its results with HTTP status 200. Now let’s look at the traces:

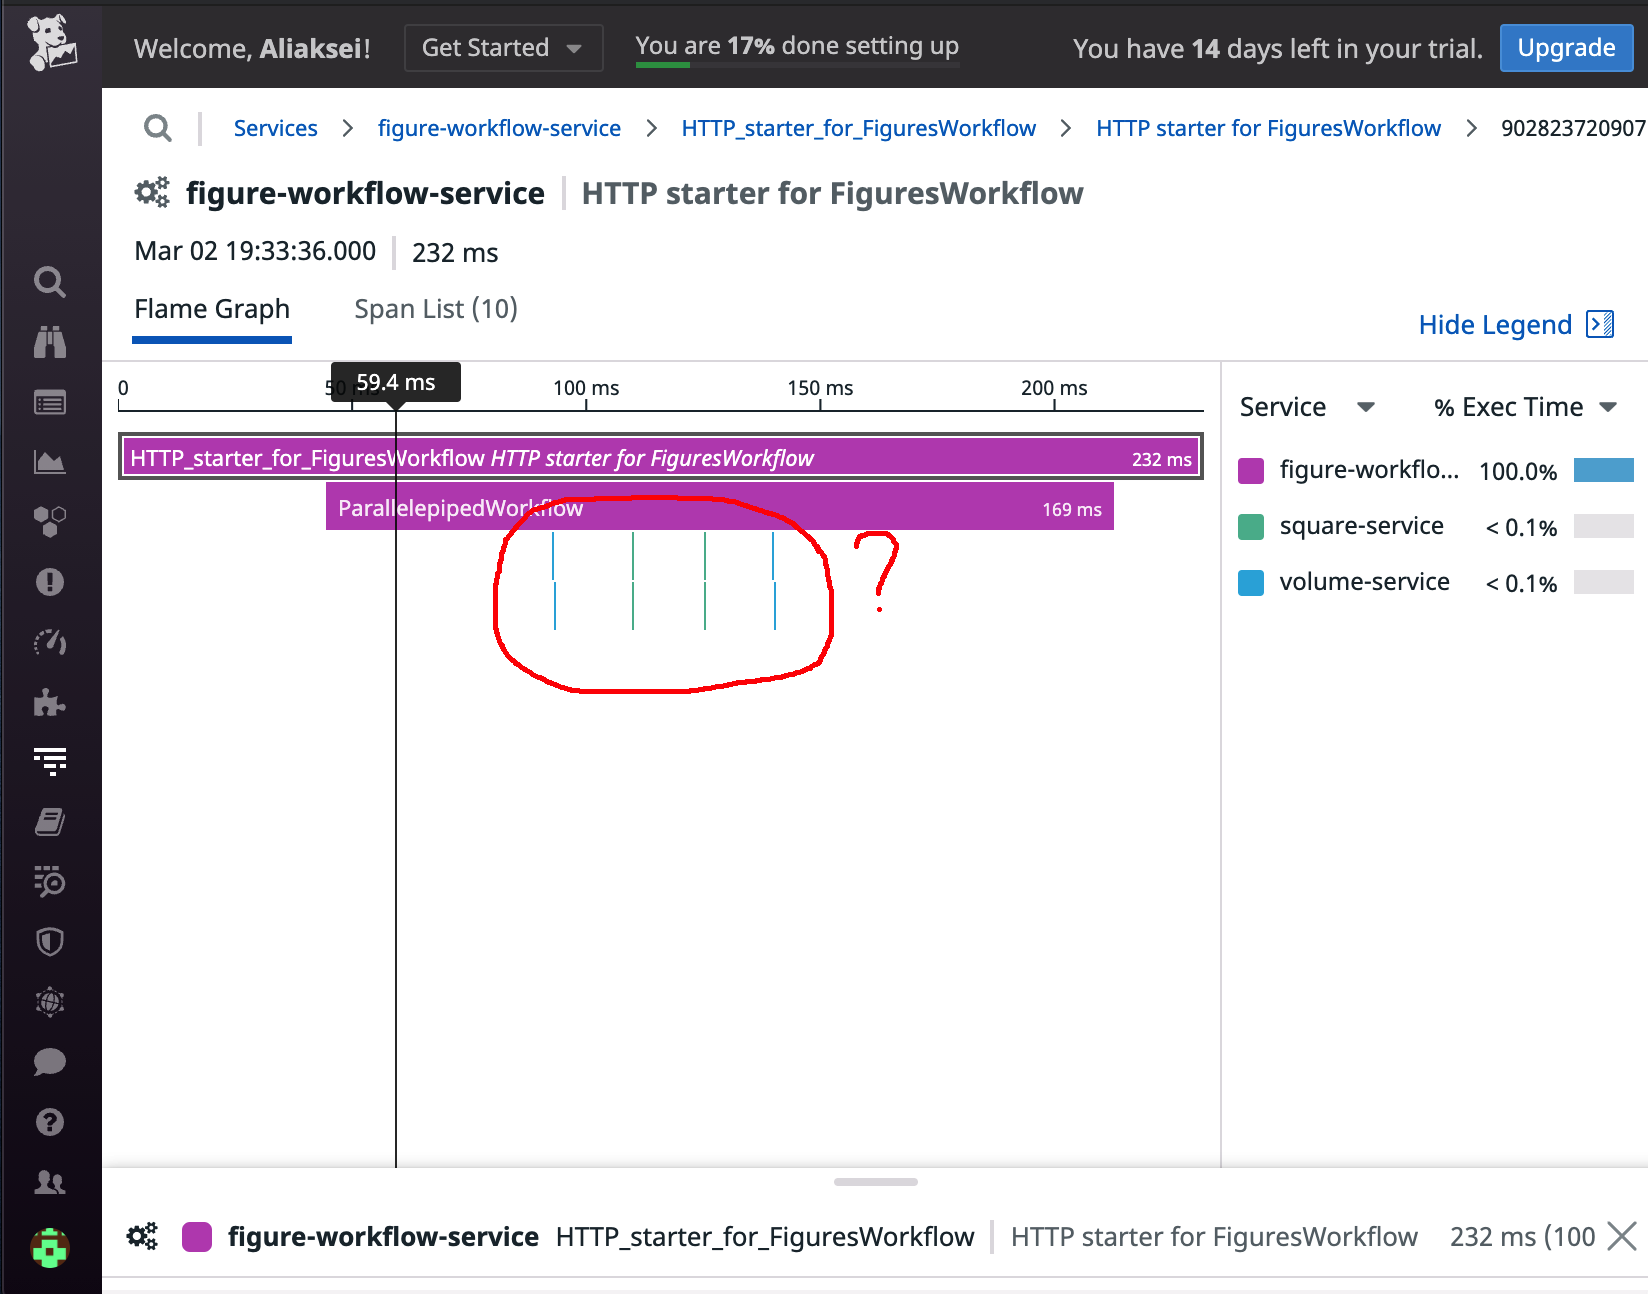
Datadog tracing flame graph where the Square and Volume spans run one after another

The Square and Volume activities run in sequence, yet the workflow is built to run them in parallel. So what is wrong? Our activities are so fast that the workflow’s own operations take longer than the activities. To fix that, add a time.Sleep(5*time.Second) instruction to the service layer. Uncomment the line in Square and the one in Volume services, then restart them.

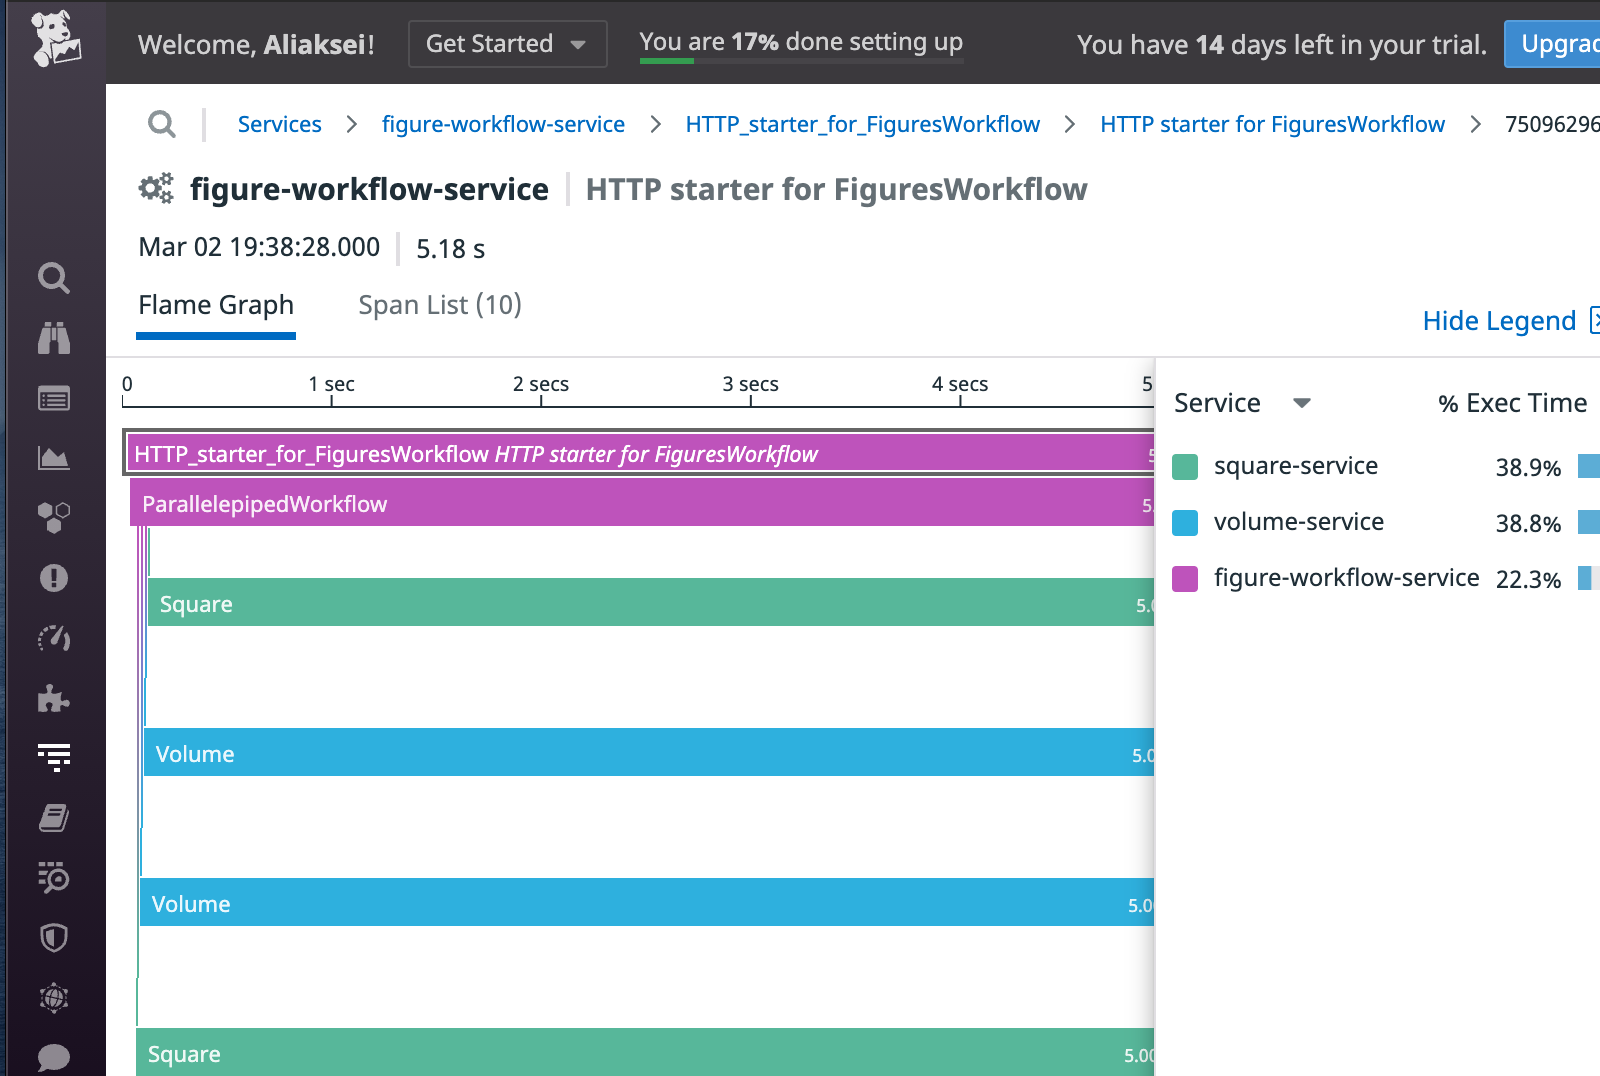
Run the workflow again, and the trace shows all the activities running in parallel, as expected:

Temporal tracing in Datadog: Square and Volume activities run in parallel after a 5-second sleep

Temporal suits relatively long processes that take at least a few seconds. Otherwise, workflow orchestration adds more latency than the business logic itself takes. Traces make all of this visible.

Conclusions

Tracing is an important part of the infrastructure for a microservices architecture, so plan it from the start of the build. Your workflow orchestration engine should support tracing, and Temporal does this well. To add Temporal tracing, use the native interceptors or write your own context propagator and span creation function. The custom route takes more work, but it gives you more control and a deeper understanding of how tracing works. In practice, start with the interceptor and keep a custom propagator for the cases it can’t cover.

Datadog is a convenient metrics and reporting service, and tracing is only one of its many features. Its main drawback is that it isn’t free.

As a Temporal partner and the team that built Temporal’s PHP SDK, we know what works and how to get your implementation right from the start. Whether you’re moving to Temporal Cloud, tuning a multi-service system or building AI agents, we’ll help you design, implement and train your team with confidence.

Building AI Agents with Temporal (Replay 2024)

AI agents that work in production need more than clever prompting. They also need durable execution. In this series, we cover the practical side of building stateful, long-running agents.

Watch the first session below, and explore the full playlist here to see how we use Temporal to handle flaky LLM providers and complex reasoning chains. The sessions also show AI workflows that pick up where they left off when a service fails, without losing a transaction. To see how we apply this for clients, visit our page on AI agents on Temporal.

FAQ

Why do I need workflow tracing in Temporal, and what benefits does it bring?

Tracing helps you visualize the full lifecycle of a workflow – from start to finish – with spans, parent/child relationships, and service-level breakdowns. While TemporalUI provides basic activity views, external tracing tools like Datadog give you deeper insights and much better visibility for diagnosing bottlenecks and optimizing system performance.

Why use Datadog instead of relying only on Temporal’s built-in tracing?

TemporalUI’s tracing is limited to displaying activity spans without much detail or flexibility. Datadog, on the other hand, is a full monitoring and observability platform, offering dashboards, alerts, rich reporting, and detailed span visualization. While it’s commercial (with a free trial available), it provides a much more complete solution.

How do you integrate Datadog with Temporal?

The blog post explains how to use custom context propagators (WorkflowHeaderWriteAdapter and WorkflowHeaderReadAdapter) to record and read trace data through workflow headers, which is the approach to use if you want a tracer-agnostic abstraction. If you just need Datadog support without that flexibility, Temporal’s Go SDK now ships an official Datadog tracing interceptor that handles this for you directly.

The production-grade automation blueprint

Stop building fragile chatbots. Get the exact 5-phase blueprint we use to extract your team’s tribal knowledge and install durable, bank-grade AI systems that actually run.

Install the machine.
Stop renting the operator.

We don’t sell hours, headcount, or throwaway POCs. We install the agent-driven systems and automation infrastructure your business needs to scale.

Discuss your infrastructure directly with a senior engineer.

Scroll to top